In today's modern data-driven sector, data visualization skills are precious. Data collection and analysis are only the first steps; to communicate your findings to clients or management, you must display the data organized and intuitively. The human mind can comprehend and interpret enormous volumes of complex material using charts and graphs.
Throughout this blog post, you'll learn how and where to utilize data visualization to analyze and comprehend data, the importance of data visualizations and data visualization tools, and then communicate findings in a powerful and meaningful way.
Let's start with a quick overview and then jump into our main topic.
The very first thing that comes to many people's minds when they think about data visualization in Tableau. Despite its tremendous benefits, Tableau stands as the most adaptable software in data analytics. In this tableau tutorial, we will discuss many functionalities related to Tableau. However, taking up tableau training under expert supervision will make you more professional in the industry.
● Importance of the data visualizations
● Data visualization tools
● What is Tableau?
● Why Tableau?
● Why should one learn Tableau?
● Applications of Tableau
● Tableau product family
● Understanding the Tableau
● Using Tableau
● Tableau charts and maps
● Strengths and exciting features of Tableau
● Conclusion
Importance of the data visualizations:
Tableau data visualization is an essential aspect of the data analytics process. It aids data scientists by presenting raw data in an intelligible manner. Also, non-technical users can benefit from the visualization to make better decisions. A data scientist should grasp data visualization abilities to better interact with end customers.
Data visualization allows data scientists to effectively communicate the results of the data analysis to end customers, allowing them to spot hidden patterns in data. It also assists outcome in better understanding the company's exact status and productivity to make much better judgments.
Companies can uncover the reasons affecting their growth and areas wherever they want to develop by visualizing the raw data. It also assists them in determining the relationship between the independent variables and calculating the risks associated with changing them.
Data visualization tools:
Here are the best 5 data visualization tools in the market. They are:
● Tableau
● Qlikview
● Domo
● Microsoft Power BI
● Excel
Tableau:
Tableau is a popular business intelligence application that is used by a variety of companies for data processing, visualization, report preparation, and publication. This provides a straightforward and user-friendly interface that allows users to connect, clean, and transform raw data into actionable insights.
Tableau could connect to datasets on-premise and in the cloud environment, including Excel spreadsheets, CSV files, Open Database Connectivity (ODBC), Oracle, Azure, or Google BigQuery. Several businesses utilize Tableau for sales data analysis, consumer segmentation, budget tracking, consumer behavioural analysis, data categorization, and predictive modelling.
Qlikview:
Qlikview is a visual data analytical environment that runs in real-time. Qlikview cannot perform the same level of visualization as other BI solutions. With the help of its dynamic models, you can analyze your data in multiple dimensions.
Qlikview offers a variety of ad hoc queries that enable fast decision and data access. It may also integrate a variety of data sources & visualize the essential data to create unified reports and dashboards. However, there are several distinctions between Tableau and QlikView. Tableau, for example, allows for quick drag and drop, making graphical inputs simple, whereas QlikView requires writing logic for regions where graphic changes are needed.
Domo:
Domo is a cloud-based data analysis platform that enables companies to do data analytics and make data-driven decisions to improve their performance. Domo's business cloud is an open-source platform that allows users to connect to various unstructured and structured data sources.
Domo has actual data visualization capabilities that may use to generate live dashboards and reports. Thanks to the superb UI features, the user can construct an interactive display with sparklines, dashboards, and useful widgets.
Microsoft Power BI:
Power BI seems to be another robust technology numerous businesses employ to deploy business intelligence capabilities. This is a collection of algorithms that enable users to execute data analytics and visualization to create visually interactive reports and dashboards.
Power BI uses AI capabilities like Power Query and Power Q&A to let users visualize data and produce highly customized reports. Non-technical individuals could use Power BI to uncover hidden connections and incorporate data. There are several distinctions between Power BI and Tableau, there are several distinctions, and Tableau allows any graph, bar, or chart, while Power BI only has regular charts, graphs, and maps.
Excel:
Excel is a widely used spreadsheet programme that includes some of the best visualization tools. One can use excel to do complicated computations and data visualization by a competent professional.
Excel may be used to swiftly analyze stored information in sheets and illustrate it using graphs and charts for internal purposes. However, data connectivity and graphics generated corporate dashboards and reports are limited.
What is Tableau?
According to Gartner, Tableau has been one of the best business intelligence and analytics products available. Tableau's business story is truly inspirational. Companies use widely to make sense of data in a visually appealing style. Tableau can work with any data type, including organized, unorganized, and semi-structured information. Tableau may also link to various other tools and platforms, including Hadoop, R Programming, and others. Tableau does not require any technical skills.
Why Tableau?
This is the most crucial aspect of every Tableau tutorial. Tableau has several characteristics that set it apart from other business intelligence software:
● Visualization: Tableau links to numerous data sources and allows for reliable representation of massive datasets. It takes a drill-down method to get to the relationship between the independent variables. In addition, the user may easily switch between several visuals.
● Performance: Tableau could connect to many data sources and manage large datasets without impacting the data engine's efficiency. Furthermore, augmented analytics assists users with various specific skills in data cleansing and visualization.
● Depth of Investigation: Tableau offers a variety of options for locating answers to the user's questions. Tableau has the best data discovery and modelling tools, including fundamental trends to complex 'what about if' queries.
● Community
●Tableau is a rapidly growing global network of expert data scientists and business analysts. In contrast to specific other BI tools, Tableau makes it simple to come up with a solution to business challenges.
Why should one learn Tableau?
One needs to acquire the tableau skills due to the following reasons. They are:
●Tableau can work with any data warehousing and ETL solution, making it highly adaptable.
● Tableau is continually evolving, making a career in Tableau extremely promising.
● Tableau has a large and expanding community, making it simple to acquire and thrive.
● Tableau does not require any specialized knowledge or development environments.
Applications of Tableau:
Tableau is a versatile tool that can be applied to every industry, thanks to its ability to handle any data. So, in this Tableau blog, we'll go over some real-word scenarios such as:
● Create rapid visualizations and conclusions from different data sources.
● You can improve query performance by using the strength of your databases.
●Work with statistical analysis characteristics such as trending and forecasting.
● Use severe data discovery to uncover previously unknown insights.
●For sophisticated table computations, it can easily interface with programming languages.
●Tableau dashboards allow you to interact with data most straightforwardly and interactively possible.
Tableau product family:
Tableau has several solutions that allow users to transfer data quickly, generate data visualizations, and create reports. Tableau products or components are listed below:
● Tableau Desktop: Tableau Desktop enables users to link data from many sources to create dashboards, reports, and spreadsheets. Using the Tableau Desktop, you may publish all of your data with other Tableau customers and publish your worksheets on the Tableau website.
● Tableau Server: The tableau server distributes Tableau Desktop reports and workbooks. It allows users to view workbooks and information from any planet.
● Tableau reader: It's a free programme that you can download to your computer and use to examine data visualizations created by the Tableau Desktop version. You may see, interact with, add various filters, and drill down into the data using Tableau Reader without altering the input datasets or visualizations.
● Tableau Public: This Tableau Public tutorial also shows how well the software is free that can be used by anybody to analyze data and generate visuals. You can build workbooks or reports and save them in Tableau Server, but all those visualizations are visible to anyone because it is public.
● Tableau Online: Tableau Web is a cloud-based tool for publishing and sharing dashboards with other users. It assists you & your coworkers work on a project and extracting valuable data that may convert into graphically engaging workbooks.
Learn how to use Tableau:
One needs to follow three steps to use tableau software and create data visualizations; they are:
● Connecting to the data source
● Interacting with the user interface
● Creating the data visualizations
Connecting with the data:
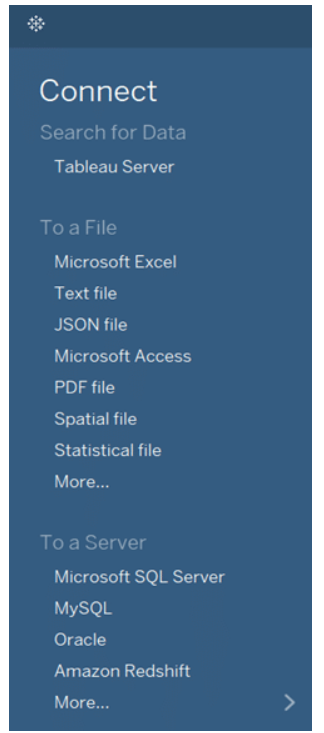
To connect to the data in Tableau you need to connect to the local file or connect to a server. Moreover, Tableau can be connect to any database such as excel, text file, database file, etc. Local connection helps in providing more data processing power. It can also be connected to any data services such as tableau server, IBM DB2, google analytics, google bigquery, SAP, Mysql, oracle etc.
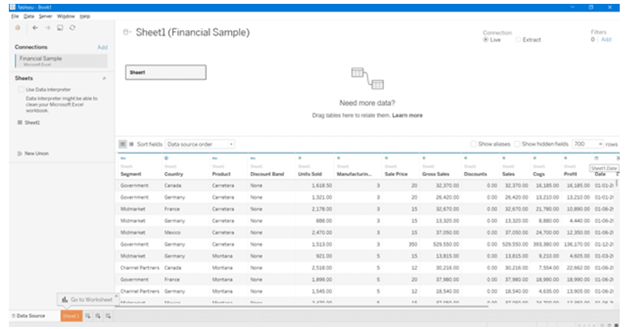
Data could have a Live Connection when processing in Tableau, which means that any changes in the source data would be updated automatically in Tableau. Data can be retrieved to a Tableau repository, however, so any adjustments introduced here would not alter the original source data.
Interacting with UI:
After you've loaded your datasets, a window will emerge with several characteristics and sets of data. The ui is shown below, where you can play around your data & navigate to the worksheets area from the bottom left corner.
Creating visualizations:
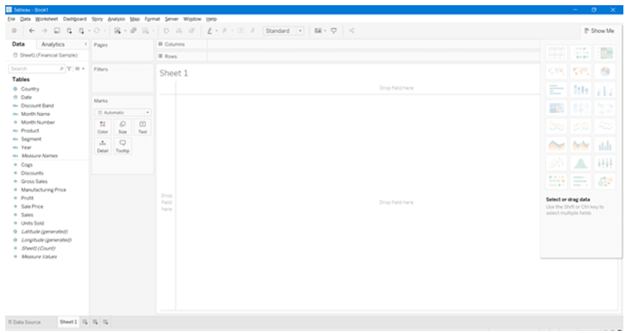
All of the capabilities needed to build outstanding visualizations will be displayed in the workbook interface. Under the Show Me section, the variables of your datasets will appear on the left side, while visuals would display here on the right side.
Tableau charts and maps
Data scientists use Tableau to produce colorful, interactive reports which virtually anybody can understand. Tableau has a number of charts, graphs, and maps that may be used to analyze business information.
● Tableau charts are used to visualize data and convey it in a simple manner.
● The easiest approach to visualize geographic data is with Tableau maps. Maps are commonly used to visualize comparisons between two or more dimensions.
Strengths and exciting features of tableau:
Here are a few of Tableau's most notable attributes and traits, that make it a highly desirable tool in today's business environment:
● Tableau data visualization that is fully engaging
● Simple to implement
● Using various scripting languages to handle vast volumes of data
● Endorse good support and a dynamic dashboard
● Various goods for various users
● High-capacity technology
● No technical knowledge is required.
Conclusion:
Anyone who wants to grow their career in data analytics can take up tableau training. Moreover, in the above mentioned data all the points related to tableau are explained very clearly. If you have any doubts please drop them in the comments to get them clarified.


No comments:
Post a Comment