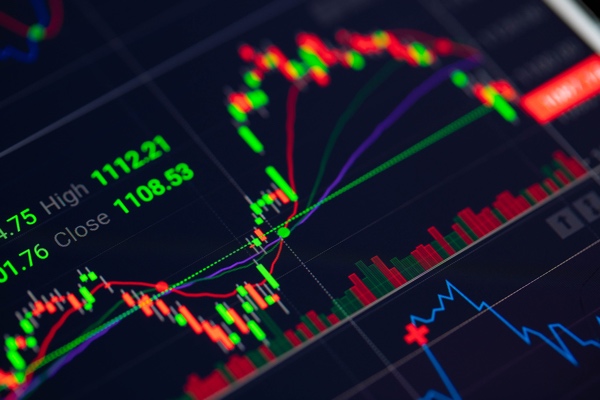
Are you new to trading but have no strategy and wonder how to make the right decisions? This is where trade indicators enter the stage. These are a significant part of technical analysis and are essentially algorithms based on mathematical formulas.
Some illustrate historical market performance based on price fluctuation in the past (so-called lag indicators). In contrast, others, like lead indicators, give information on what market changes are expected.
Beginner or an expert, understanding indicators is necessary for technical analysis that will help you to find regularities, filter out price noise, determine general price value movements, and measure the trend strength.
Here is a simple explanation of the carefully selected day trading indicators to build your confidence and start exchanging currencies.
Moving Average
Moving Average (MA) is a lag indicator that identifies a trend. This indicator shows the average value of a price in a specified period. MA focuses only on the main trend of the price, excluding price noise and volatility. You can choose and set different periods; however most popular are 200-day, 100-day, and 50-day.
Practically, MA tells you to buy a currency pair when it is in an uptrend and to sell if in a downtrend. This indicator is best for beginners. Change parameters in the demo version of any B2B forex trading platform such as Fazzaco, and you will get a deeper understanding of interpretation.
Bollinger Bands
Bollinger Bands is another lag channel indicator that combines oscillator and volatility tool features. The chart contains two lines that create a channel. The candlesticks present the price moving up and down with a tendency to stay in the middle.
When the candlestick crosses the upper or lower borderline, it signalizes profitable trends. If the candlestick comes closer to the upper band, you can use the provided price advantage to make a profit and close a trade. This is a selling signal, whereas the opposite indicates to buy.
Bollinger Bands indicates lower market volatility when the narrow channel and the candlestick are short. This indicator is recommended for a non-trending market in combination with other indicators.
Moving Average Convergence/Divergence (MACD)
Moving Average Convergence/Divergence is a lag oscillator indicator that will show you the different phases of the market. This tool contains a histogram with two lines. The first, the MACD line, defines price momentum, and the second, the signal line, provides entry signals.
The trend rises when the bars are increasing upside, colored in green, and the lines have an upward direction. Longer bars indicate a stronger movement, and small bars and converged lines indicate a balanced market.
MACD is a strong and complex indicator used by those familiar with MA.
Relative Strength Index
The Relative Strength Index (RSI) is a lead oscillator indicator where the signal line moves between 0 and 100. It signals the trend reversal or strengthening when it comes closer to the upper or lower border.
This means we're talking about oversold if the line is closer to the lower border. The opposite, overbought, is when the signal line is near the upper frame.
RSI is very popular for beginners as it is easy to understand.
Commodity Channel Index
Commodity Channel Index (CCI) is another lead indicator that measures how the current price deviates from its average value. The range this index moves in is between 100 and -100. When CCI is above zero, it indicates that the current price is better than the average one in the past.
CCI is suitable for any timeframe, and it's recommended to be used with other oscillators.
Zig Zag
Zig Zag is an excellent complementary indicator for a medium and long-term trading strategy as it informs you where the price is expected to reverse. This indicator is helpful for trend identification and building resistance levels in strong trending markets.
You can filter out price moves by setting the limits for this strategy. The distance between the frames, i.e., the higher the price change, the less sensitive the indicator. So, you will get more zig-zag patterns for a shorter period, which determine the trend line.
Zig Zag is best used with channel indicators, like Bollinger Bands.
Pivot Point
A pivot point is another widely used indicator that informs about the particular pair's demand and supply, regardless of the timeframe. The pivot point is determined by the previous day's low, close, and high price.
If the price riches the pivot point level, it indicates that supply and demand are equal. If the cost exceeds the pivot point, high demand and competition exist.
Which Forex Indicator is For You?
You can find dozens more indicators, each with its specific role that will lift you to a more advanced level. Some can also be used for stock and crypto trade.
Try out several combinations through a demo account, and then head to the real market with the acquired knowledge.

No comments:
Post a Comment